
Advertisement


Wealth Trades is an no profit business proprietary for giving information and knowledge in stock market. Here you can find, how to pick mostly profit making shares , Technical analysis of stocks , Fundamental Analysis ,Share market news , Tips and Shares to hold for a lifetime.


Exponential Moving Average (EMA)
Exponential Moving Average (EMA) is a type of moving average that gives more weight to the most recent data points. This makes it a more responsive indicator than a simple moving average, which gives equal weight to all data points.
Introduction
EMA stands for Exponential Moving Average. It is a type of moving average that gives more weight to the most recent data points. This makes it a more responsive indicator than a simple moving average, which gives equal weight to all data points.
The EMA is calculated by multiplying the most recent price by a factor, then adding that product to the previous EMA value. The factor is typically between 0 and 1, and it determines how much weight is given to the most recent data point. A higher factor will give more weight to the most recent data point, and a lower factor will give more weight to the older data points.
The EMA is often used to smooth out price data and identify trends. It can also be used to generate trading signals. For example, a trader might buy a stock when the EMA crosses above the price of the stock, and sell the stock when the EMA crosses below the price of the stock.
The EMA is a versatile indicator that can be used in a variety of ways. It is a popular choice for traders of all experience levels.
Here are some of the advantages of using the EMA:
- It is a more responsive indicator than a simple moving average.
- It can be used to identify trends.
- It can be used to generate trading signals.
- It is relatively easy to calculate and use.
Here are some of the disadvantages of using the EMA:
- It can be more volatile than a simple moving average.
- It can be sensitive to outliers.
- It can be difficult to interpret the signals generated by the EMA.
Overall, the EMA is a versatile and useful indicator that can be used in a variety of ways. It is a popular choice for traders of all experience levels.
Custom made EMA.
LINK: https://www.mql5.com/en/market/product/103212
(5 EMA 14 EMA 20 EMA 200 EMA)
Types
There are two main types of EMA: simple EMA and weighted EMA.
Simple EMA
The simple EMA is the most basic type of EMA. It is calculated by multiplying the most recent price by a factor, then adding that product to the previous EMA value. The factor is typically between 0 and 1, and it determines how much weight is given to the most recent data point. A higher factor will give more weight to the most recent data point, and a lower factor will give more weight to the older data points.
Weighted EMA
The weighted EMA is a more sophisticated type of EMA. It gives more weight to the older data points than the simple EMA. This makes it less responsive to recent price changes, but it also makes it more reliable over time.
The weighted EMA is calculated by multiplying each data point by a factor, then adding those products together. The factors are typically calculated using a Fibonacci sequence.
Here are some of the most common types of EMA:
- Short-term EMA: A short-term EMA is typically used to identify short-term trends. It is often used to generate trading signals. For example, a trader might buy a stock when the short-term EMA crosses above the long-term EMA, and sell the stock when the short-term EMA crosses below the long-term EMA.
- Long-term EMA: A long-term EMA is typically used to identify long-term trends. It is not as responsive as a short-term EMA, but it is more reliable over time.
- Double EMA: A double EMA is two EMAs of different lengths plotted together. This can be used to identify divergences, which can be a sign of a trend reversal.
- Triple EMA: A triple EMA is three EMAs of different lengths plotted together. This can be used to identify more complex trends and patterns.
The type of EMA that you use will depend on your trading style and the time frame that you are trading. For example, if you are a short-term trader, you might use a short-term EMA to identify short-term trends. If you are a long-term trader, you might use a long-term EMA to identify long-term trends.
It is important to note that no single indicator is perfect. The EMA is a useful tool, but it should be used in conjunction with other indicators and analysis to make trading decisions.
Types of EMA according to to number of candles
The 5 EMA, 14 EMA, 20 EMA, 50 EMA, and 200 EMA are all types of exponential moving averages (EMAs). EMAs are a type of moving average that gives more weight to recent price data. This makes them more responsive to price changes than simple moving averages (SMAs).
The 5 EMA is the shortest of the EMAs listed above. It is typically used to identify short-term trends and generate trading signals.
The 14 EMA is a bit longer than the 5 EMA and is also used to identify short-term trends.
The 20 EMA is a bit longer than the 14 EMA and is often used to identify medium-term trends.
The 50 EMA is the longest of the EMAs listed above and is used to identify long-term trends.
The 200 EMA is also used to identify long-term trends, but it is less responsive to price changes than the 50 EMA.
The length of the EMA that you use will depend on your trading style and the time frame that you are trading.
For example,
If you are a short-term trader, you might use the 5 EMA or 14 EMA or 20 EMA.
If you are a long-term trader, you might use the 50 EMA or 200 EMA.
Percentage of accuracy
The accuracy of the EMA depends on a number of factors, including the length of the EMA, the volatility of the market, and the trading strategy that is used.
In general, the longer the EMA, the more accurate it will be. This is because the longer EMAs are less responsive to recent price changes, which can help to filter out noise and identify more reliable trends. However, longer EMAs can also be less responsive to sudden changes in the market, which can lead to missed opportunities.
The volatility of the market also affects the accuracy of the EMA. In a volatile market, the EMA will be less accurate than in a stable market. This is because the EMA will be more likely to be whipsawed by the frequent price changes.
The trading strategy that is used also affects the accuracy of the EMA. For example, a trader who uses the EMA to generate trading signals will likely have a higher accuracy than a trader who uses the EMA for trend identification.
Custom made EMA.
LINK: https://www.mql5.com/en/market/product/103212
(5 EMA 14 EMA 20 EMA 200 EMA)
| EMA | Length | Used for |
|---|---|---|
| 5 Candles (5 Days) | 5 Days | Short-term trends and trading signals |
| 14 Candles (14 Days) | 14 Days | Short-term trends and trading signals |
| 20 Candles (20 Days) | 20 Days | Medium-term trends |
| 50 Candles (50 Days) | 50 Days | Long-term trends |
| 200 Candles (200 Days) | 200 Days | Long-term trends |
Certainly, here is some more detailed information about Exponential Moving Averages (EMA):
What is an Exponential Moving Average (EMA)? An Exponential Moving Average (EMA) is a type of moving average that gives more weight to recent data points while calculating the average. Unlike the Simple Moving Average (SMA), which assigns equal weight to all data points in the calculation period, the EMA places greater emphasis on the most recent prices. This makes the EMA more responsive to recent price changes and helps traders identify trends more quickly.
EMA Calculation Formula: The formula to calculate the EMA involves several steps:
- Calculate the SMA for the desired period.
- Calculate the multiplier (2 / [selected period + 1]).
- Calculate the EMA for the current period using the formula: EMA = (Current Price - Previous EMA) × Multiplier + Previous EMA.
Significance of Different EMAs:
5 EMA: Used to capture short-term trends and potential entry/exit points for quick trades.
14 EMA: Provides a balance between short-term and medium-term trends. Used to identify trend direction and confirm potential reversals.
20 EMA: Similar to the 14 EMA, used for identifying trends, support, and resistance levels in the short to medium term.
50 EMA: Used to assess medium-term trend strength and potential trend changes. Crossovers with shorter EMAs can signal significant shifts.
200 EMA: Represents long-term trend direction. Used by investors to gauge the overall health of a market or security.
Interpreting EMAs:
- Trend Identification: When the price is above an EMA, it suggests an uptrend. When below, it suggests a downtrend.
- Crossovers: When a shorter EMA crosses above a longer EMA, it may indicate a potential bullish signal. Conversely, a crossover below could signal bearishness.
- Support and Resistance: EMAs can act as dynamic support (in uptrends) or resistance (in downtrends).
- Divergence: If the price is moving in one direction while the EMA is moving in the opposite direction, it could signal a potential reversal.
Accuracy and Limitations:
- EMAs are effective in trending markets but may give false signals in sideways or choppy markets.
- EMAs alone may not guarantee accurate predictions. They should be used in conjunction with other indicators or analysis methods.
- Interpretation can be subjective; traders might have different criteria for identifying trends and signals.
- EMAs may lag during rapid price changes.
- Risk management is crucial. Not all signals will lead to profitable trades.
Remember that no single indicator guarantees success in trading. Traders often use a combination of indicators, patterns, and fundamental analysis to make informed decisions. The choice of EMAs and their accuracy depend on a trader's strategy, experience, and the specific market conditions being analyzed.
Certainly, let's explore trading strategies for different currency pairs:
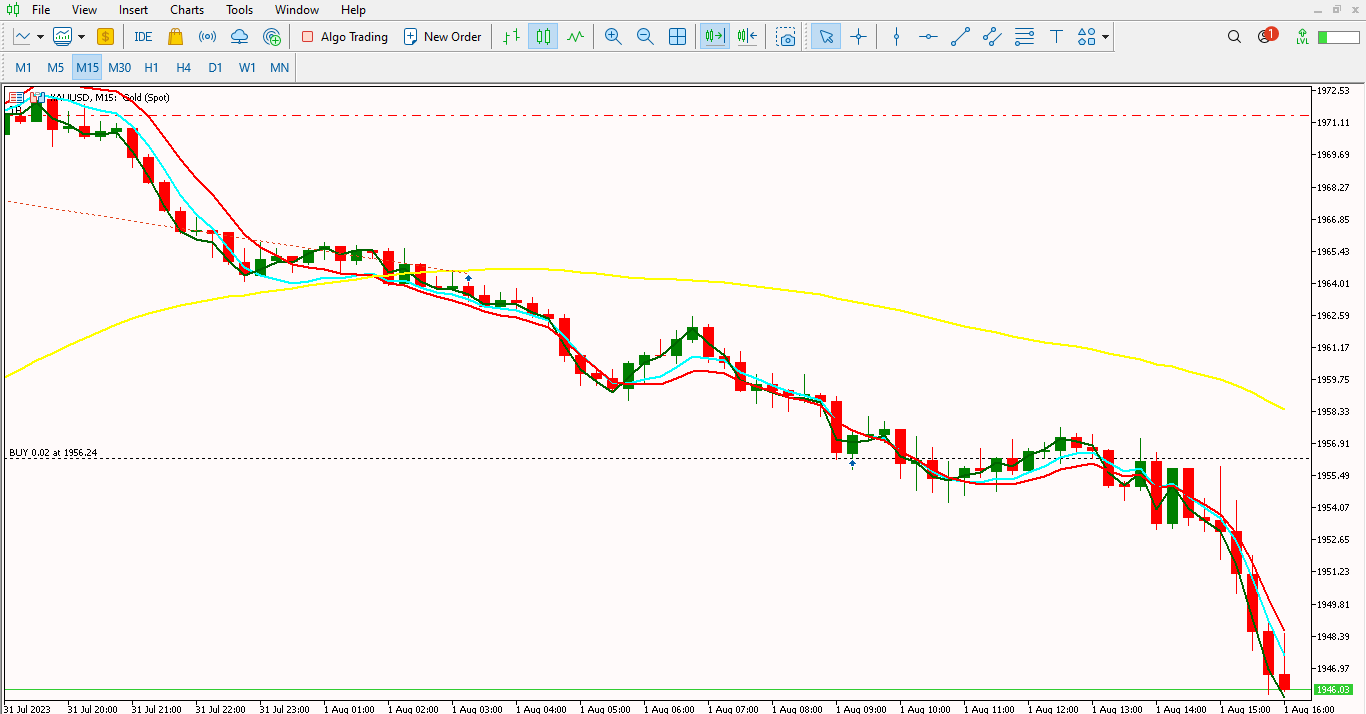
XAUUSD (Gold/US Dollar):
- Trend Following: Use moving averages (e.g., 50 EMA, 200 EMA) to identify trends. Buy when the price is above the moving averages and sell when below.
- Support and Resistance: Identify key support and resistance levels on the chart and trade bounces or breakouts.
- Volatility Breakout: Buy when there's a significant breakout above a resistance level or sell on a breakdown below support.
US100 (NASDAQ 100 Index/US Dollar):
- Trend Riding: Follow the dominant trend by using moving averages (e.g., 20 EMA, 50 EMA) and trade in the direction of the trend.
- Breakout Strategy: Identify key technical levels, such as all-time highs or lows, and trade breakouts with appropriate risk management.
- Earnings Season: During quarterly earnings reports, trade based on market sentiment and expectations for specific companies in the index.
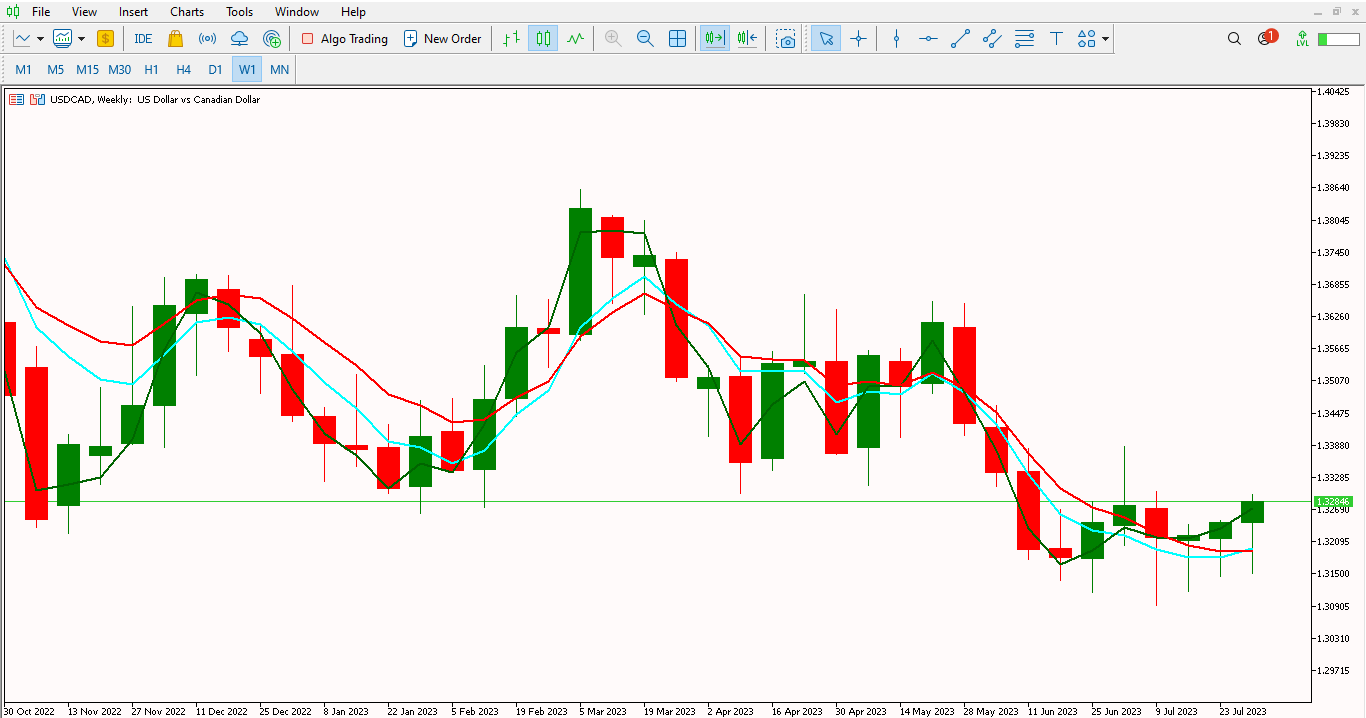
USDCAD (US Dollar/Canadian Dollar):
- Trend Reversal: Look for oversold or overbought conditions using indicators like RSI (Relative Strength Index) and trade potential reversals.
- Oil Price Correlation: Monitor crude oil prices, as the Canadian dollar is often influenced by oil. Trade when there's a correlation between oil prices and the currency pair.
- Support and Resistance: Identify key levels where the price has historically bounced or broken through and trade accordingly.
EURUSD (Euro/US Dollar):
- Moving Average Crossovers: Use crossovers of short-term (e.g., 5 EMA) and long-term (e.g., 50 EMA) moving averages as potential entry/exit signals.
- Fundamental Analysis: Pay attention to economic data releases and central bank decisions from the Eurozone and the US.
- Breakout Strategy: Trade breakouts from well-defined support or resistance levels with confirmation from other indicators.
GBPUSD (British Pound/US Dollar):
- Brexit News: Keep an eye on Brexit-related news and trade based on market sentiment as negotiations and developments unfold.
- Range Trading: Trade within a well-defined range by buying at support and selling at resistance until a breakout occurs.
- Major Economic Data: React to major economic indicators and central bank announcements from both the UK and the US.
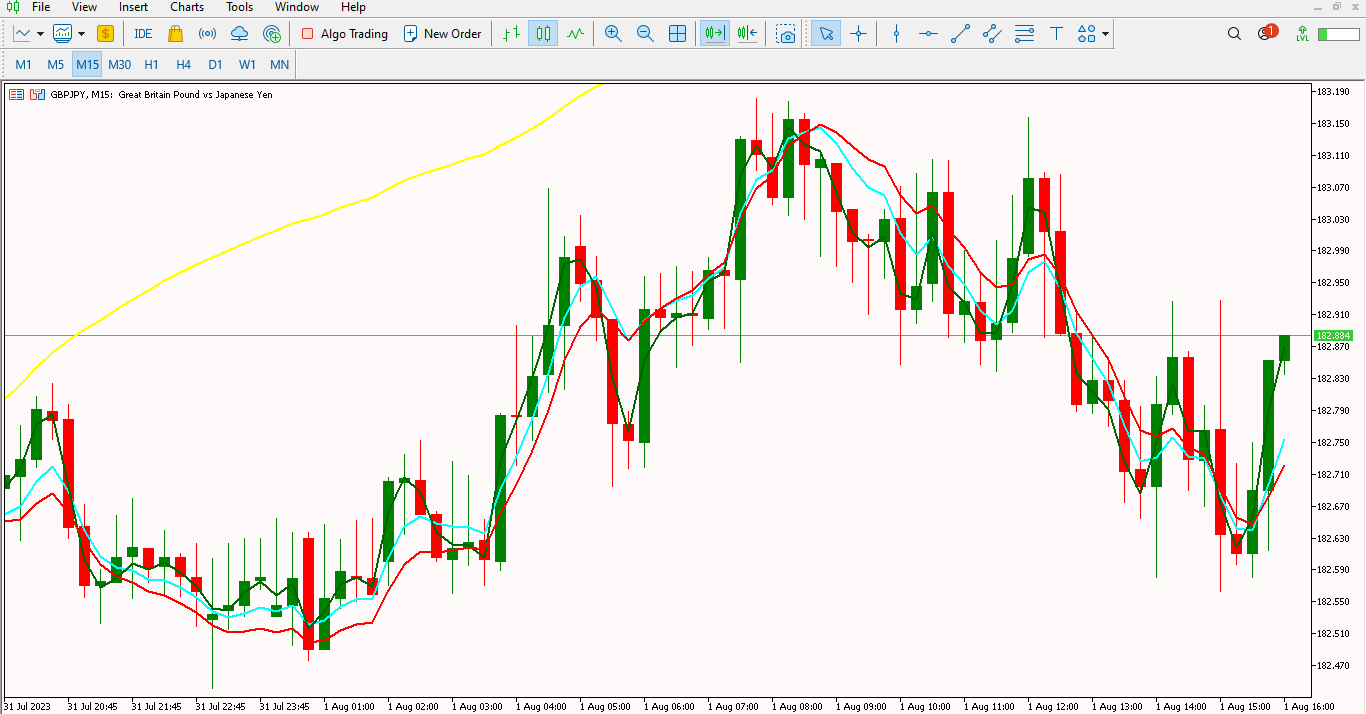
USDJPY (US Dollar/Japanese Yen):
- Carry Trade Strategy: USDJPY is often used in carry trades due to the low interest rates in Japan. Traders may borrow in JPY at a low rate and invest in higher-yielding assets.
- Safe-Haven Play: JPY is considered a safe-haven currency. During times of uncertainty, traders might buy JPY as a hedge against risk.
- Technical Analysis: Apply technical indicators (e.g., Fibonacci retracements, support/resistance levels) to identify potential entry and exit points.
AUDUSD (Australian Dollar/US Dollar):
- Commodity Correlation: AUDUSD often correlates with commodity prices, particularly metals and minerals. Monitor commodity markets for potential trading cues.
- Interest Rate Differential: Consider interest rate differentials between Australia and the US, as they can impact the currency pair.
- Breakout and Trend Trading: Use technical analysis to identify breakouts from key levels and trade with the trend.
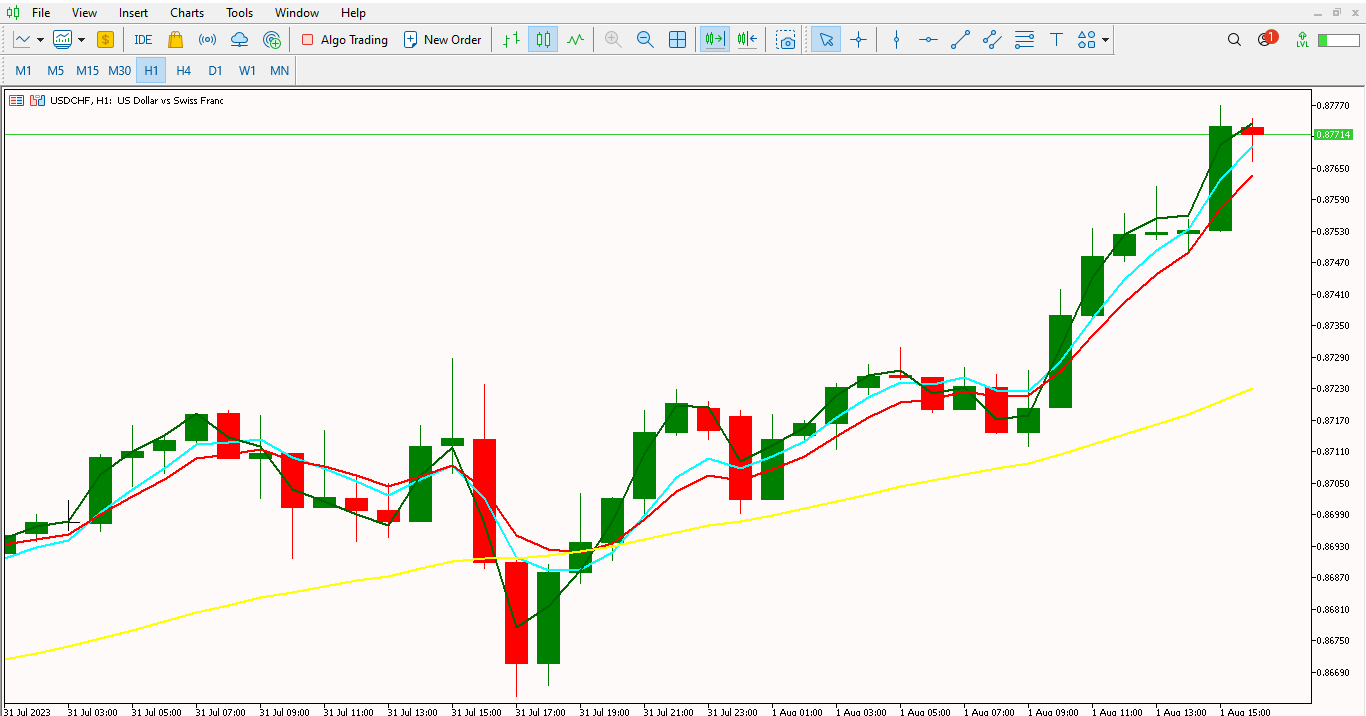
USDCHF (US Dollar/Swiss Franc):
- Swiss National Bank (SNB) Interventions: Be aware of potential interventions by the SNB to prevent excessive appreciation of the Swiss Franc. These interventions can lead to sudden price movements.
- Safe-Haven Consideration: Like JPY, the Swiss Franc is also considered a safe-haven currency. It can be used as a hedge during market uncertainties.
- Technical Patterns: Look for technical patterns (e.g., head and shoulders, double tops/bottoms) to identify potential reversal points.
WTI Crude Oil Market:
- Supply and Demand Analysis: Monitor global oil supply and demand dynamics, geopolitical events, and OPEC decisions to anticipate price movements.
- Price Patterns: Analyze chart patterns (e.g., flags, triangles) and trade breakouts or reversals.
- Inventories and Data Releases: React to weekly crude oil inventory reports and economic data that impact oil prices.
Remember, regardless of the currency pair, some general trading principles apply:
- Risk Management: Determine your risk tolerance and set stop-loss orders to protect your capital.
- Position Sizing: Adjust your position size based on your account size and risk per trade.
- Timeframe: Choose a timeframe that aligns with your trading style (e.g., day trading, swing trading, long-term investing).
- Confirmation: Use multiple indicators or tools to confirm your trading signals.
- Practice and Education: Continuously improve your skills through education, backtesting, and paper trading before committing real capital.
Every trading strategy carries risks, and past performance is not indicative of future results. It's essential to stay informed, adaptable, and disciplined in your approach.
Examples
Conclusion
EMAs are a versatile tool that can be used in a variety of ways. They can be used to identify trends, generate trading signals, and filter out noise.
However, it is important to note that no single indicator is perfect. The EMA is a useful tool, but it should be used in conjunction with other indicators and analysis to make trading decisions.
Here are some risk statements that you should consider when using EMAs:
- EMAs can be more volatile than SMAs. This means that they can be more prone to false signals.
- EMAs can be sensitive to outliers. This means that they can be affected by large price movements that are not representative of the overall trend.
- It can be difficult to interpret the signals generated by the EMA. This is because the signals can be ambiguous and can lead to missed opportunities or losses.
It is important to understand the risks associated with using EMAs before using them for trading. You should also use them in conjunction with other indicators and analysis to make trading decisions.
Here are some additional risk statements that you should consider:
- You should always use stop-losses when trading with EMAs. This will help to limit your losses if the market moves against you.
- You should not risk more than you can afford to lose when trading with EMAs.
- You should only trade with EMAs if you understand how they work and the risks involved.
It is important to remember that trading is a risky activity and there is no guarantee of success. You should always do your own research and consult with a financial advisor before making any trading decisions.
0 Comments