CENTRAL PIVOT RANGE
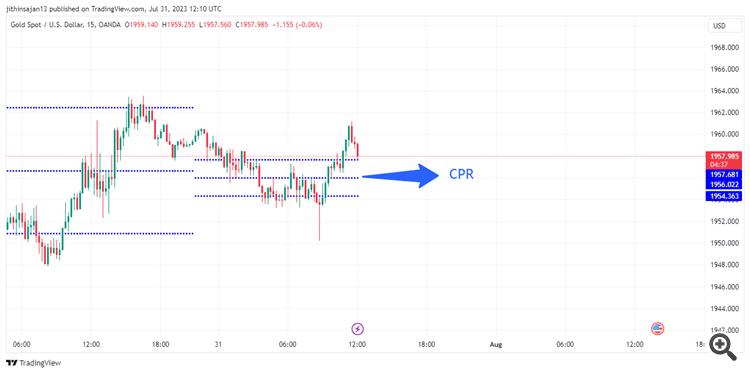
The Central Pivot Range (CPR), also known as the Pivot Range or Central Pivot Point, is a technical analysis indicator used in trading financial markets, particularly in day trading and intraday trading. It is a variation of the standard Pivot Points and is calculated using the high, low, and close prices of the previous trading session.
The Central Pivot Range consists of three key levels:
Pivot Point (PP): This is the central or average price level for the previous trading session.
It is calculated as the average of the high, low, and close prices from the previous day:
PP = (High + Low + Close) / 3
Upper Pivot Range (UPR): This level is calculated by adding the high price from the previous day to the Pivot Point and then subtracting the low price:
UPR = PP + (High - Low)
Lower Pivot Range (LPR): This level is calculated by subtracting the high price from the previous day from the Pivot Point and then adding the low price:
LPR = PP - (High - Low)
The Central Pivot Range is believed to provide traders with potential support and resistance levels for the current trading day. The Pivot Point itself is considered a key level, and traders often watch for price reactions around this point. The Upper Pivot Range and Lower Pivot Range can serve as additional levels of support and resistance, indicating potential price boundaries for the day. Traders use the Central Pivot Range in conjunction with other technical indicators and price action analysis to make trading decisions. By understanding the relationship between the previous day's price range and the Pivot Point, traders may identify potential entry and exit points, as well as assess the overall market sentiment for the current trading session. However, like any technical indicator, the Central Pivot Range should be used with caution and in conjunction with other analysis tools to improve the probability of successful trading outcomes.
Let's take a closer look at the three key levels that make up the Central Pivot Range (CPR):
Pivot Point (PP):
The Pivot Point is the central or average price level for the previous trading session. It serves as a reference point around which price action may rotate during the current trading day.
The Pivot Point is calculated as the average of the high, low, and close prices from the previous day:
PP = (High + Low + Close) / 3
Where:
High: The highest price reached during the previous trading session.
Low: The lowest price reached during the previous trading session.
Close: The closing price of the previous trading session.
The Pivot Point is considered a crucial level in the CPR and is often used by traders to gauge the overall market sentiment. If the price is above the Pivot Point, it may indicate a bullish sentiment, while if the price is below the Pivot Point, it may suggest a bearish sentiment. Traders observe how the price behaves around the Pivot Point to make decisions on potential market direction and trading strategies.
Upper Pivot Range (UPR):
The Upper Pivot Range is the upper boundary of the CPR and is calculated by adding the high price from the previous day to the Pivot Point and then subtracting the low price:
UPR = PP + (High - Low)
The Upper Pivot Range is seen as a potential resistance level for the current trading day. If the price rises above this level, it may indicate bullish momentum and could potentially lead to further upward movement. Conversely, if the price approaches the Upper Pivot Range and shows signs of stalling or reversing, it could signal a potential resistance area where sellers may become active.
Lower Pivot Range (LPR):
The Lower Pivot Range is the lower boundary of the CPR and is calculated by subtracting the high price from the previous day from the Pivot Point and then adding the low price:
LPR = PP - (High - Low)
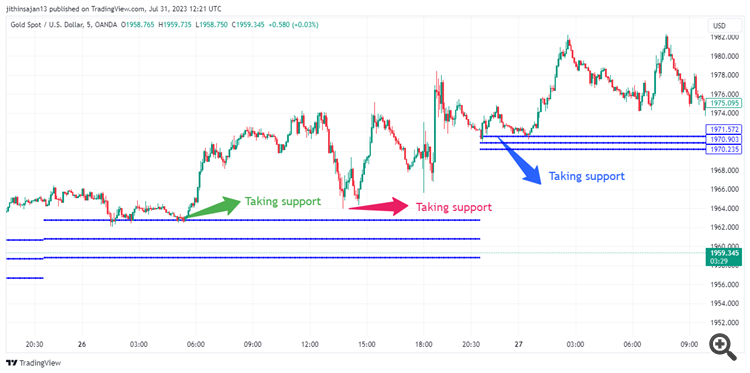
The Lower Pivot Range is considered a possible support level for the current trading day. If the price falls below this level, it may indicate bearish momentum and could potentially lead to further downward movement. If the price approaches the Lower Pivot Range and shows signs of bouncing or reversing, it could indicate a potential support area where buyers may become active.
By monitoring how the price interacts with these three key levels, traders can gain insights into potential support and resistance areas, assess market sentiment, and make more informed trading decisions. However, it is important to remember that no single indicator guarantees market predictions, and traders often use multiple tools and analysis techniques to enhance their trading strategies.
TYPES OF CPR
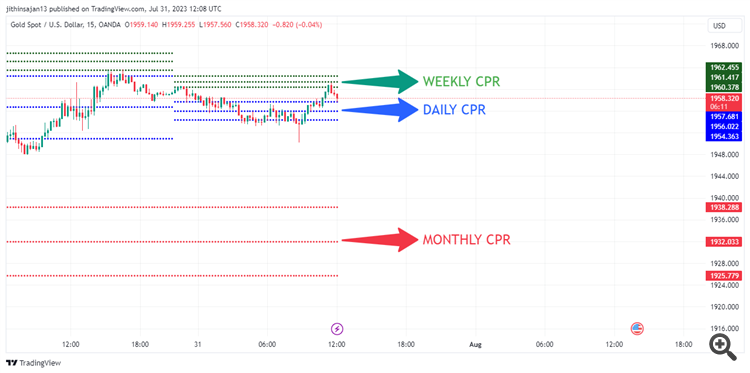
(1) DAILY CPR
(2) WEEKLY CPR
(3) MONTHLY CPR
- Daily Central Pivot Range (CPR): The Daily CPR, also known as the Daily Pivot Range, is the type of CPR that I explained earlier. It is calculated based on the high, low, and close prices of the previous trading day and provides potential support and resistance levels for the current trading day.
- Weekly Central Pivot Range (CPR): The Weekly CPR, also known as the Weekly Pivot Range, is a variation of the CPR that is calculated using price data from the previous trading week. Instead of using daily price data, the Weekly CPR uses the high, low, and close prices of the previous week to calculate the Pivot Point, Upper Pivot Range, and Lower Pivot Range. The levels derived from the Weekly CPR can be used by traders to assess potential price movements and significant support and resistance areas for the current trading week.
- Monthly Central Pivot Range (CPR): The Monthly CPR, also known as the Monthly Pivot Range, is another variation of the CPR that uses price data from the previous trading month. By calculating the Pivot Point, Upper Pivot Range, and Lower Pivot Range based on the high, low, and close prices of the previous month, traders can gain insights into potential long-term support and resistance levels for the current trading month.
All three variations of CPR are used by traders to analyze price movements and identify potential areas of interest for trading decisions. The timeframes of Daily, Weekly, and Monthly CPR allow traders to gauge short-term, medium-term, and long-term market dynamics, respectively. It's essential to remember that CPR is just one of many tools available for technical analysis, and traders often use it in combination with other indicators and methods to make well-informed trading decisions.
TYPES OF CPR ACCORDING TO RANGE BETWEEN UUPPER PIVOT & LOWER PIVOT
Wide CPR (Central Pivot Range) and Narrow CPR are terms used to describe the range between the upper pivot (UP) and the lower pivot (LP) in the CPR indicator. The width of the CPR range can provide valuable insights into market volatility and potential price movements. Here's an explanation of each:
Wide CPR:
- A wide CPR occurs when the distance between the upper pivot (UP) and the lower pivot (LP) is relatively large.
- This indicates higher market volatility and potential for significant price swings during the trading day.
- Traders might interpret a wide CPR as a more uncertain market environment, and it could suggest the possibility of larger price movements and trading opportunities.
- In a wide CPR scenario, the price may have a higher chance of breaking through either the UP or LP levels, leading to potential breakout trading opportunities.
Narrow CPR:
- A narrow CPR occurs when the distance between the upper pivot (UP) and the lower pivot (LP) is relatively small.
- This suggests lower market volatility and a more stable price range during the trading day.
- Traders might interpret a narrow CPR as a market in a consolidating phase, where the price tends to stay within a tighter range and might find it challenging to break above the UP or below the LP.
- In a narrow CPR scenario, traders might consider employing range-bound strategies, such as trading reversals or using support and resistance levels.
Both wide and narrow CPRs have their implications for trading. Wide CPRs indicate higher uncertainty and potential for more significant price movements, which can be favorable for breakout traders. On the other hand, narrow CPRs suggest a more stable market with limited price movements, making range-bound strategies more suitable.
As a trader, it's essential to be aware of the CPR width and adjust your trading strategy accordingly. Always combine CPR analysis with other indicators and technical analysis tools to gain a comprehensive understanding of the market dynamics before making trading decisions.
Certainly! Let's delve a bit deeper into the implications and considerations of Wide CPR and Narrow CPR in trading:
Wide CPR:
Volatility Trading: A wide CPR indicates higher market volatility, making it attractive for traders who prefer volatility and are comfortable with taking higher risks. Volatility traders look for strong price movements and capitalize on price swings.
Breakout Strategies: With higher volatility, the likelihood of price breaking out above the upper pivot (UP) or below the lower pivot (LP) increases. Breakout traders might enter positions when the price breaks above the UP or below the LP, expecting momentum to continue in the breakout direction.
Trend Following: Wide CPR environments might be favorable for trend-following strategies. Traders look to identify a strong trend early in its development and ride it until signs of a potential reversal.
Higher Reward Potential: While trading in wide CPR environments can carry higher risks, it also offers the potential for larger profits due to the more significant price movements.
Increased Stop-loss Sensitivity: Due to higher volatility, traders may need to set wider stop-loss orders to account for potential price fluctuations. This consideration is crucial to manage risk effectively.
Narrow CPR:
Range-Bound Strategies: In a narrow CPR scenario, where the price is relatively stable, range-bound strategies become more appropriate. Traders look for opportunities to buy near the lower pivot (LP) and sell near the upper pivot (UP).
Mean Reversion: Narrow CPR environments can be conducive to mean reversion strategies. Traders anticipate that the price will revert to the mean or average value when it reaches extreme levels, such as UP or LP.
Consolidation Phase: A narrow CPR might signal a consolidation phase in the market. Traders might stay on the sidelines and wait for a clear breakout or breakdown from the narrow range to identify the next directional bias.
Lower Risk Profiles: In a narrow CPR, price movements are typically smaller, resulting in reduced volatility. Traders who prefer lower risk and a more predictable environment may find these conditions appealing.
Tighter Stop-loss Orders: With smaller price movements, traders may use tighter stop-loss orders to manage risk effectively, as the price is less likely to experience significant fluctuations.
It's essential to adapt your trading strategy based on the prevailing CPR width and combine CPR analysis with other indicators and tools. Additionally, consider the overall market context, such as economic events and news releases, as they can impact market volatility and invalidate certain trading strategies. Always practice proper risk management and have a clear understanding of the risks associated with any trading approach you employ.
TRADING STRATEGIES WITH CPR
In trading, CPR (Central Pivot Range) is a technical indicator used to identify potential support and resistance levels for a given trading day. The CPR consists of three main lines: the central pivot (CP), the upper pivot (UP), and the lower pivot (LP). Traders can use CPR in conjunction with other indicators and analysis to develop trading strategies. Here are a few trading strategies that involve CPR:
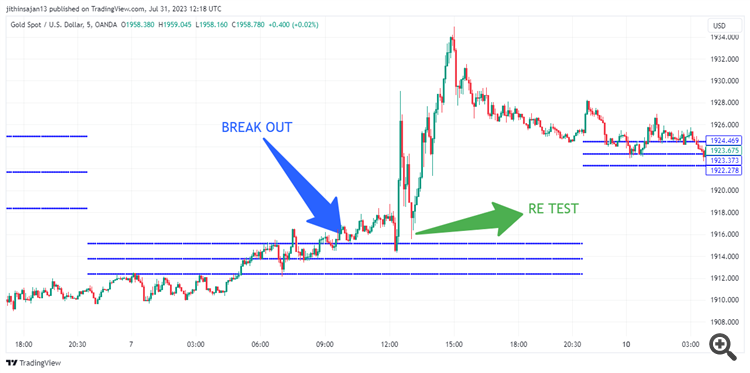
1 CPR Breakout Strategy:
- Wait for the market to open and calculate the CPR levels (CP, UP, and LP) based on the previous day's price action.
- Monitor the price movement during the trading day.
- If the price breaks above the UP level, it may indicate a bullish trend, and you can consider entering a long position.
- If the price breaks below the LP level, it may indicate a bearish trend, and you can consider entering a short position.
- Use stop-loss orders to manage risk and protect your capital.
- Similar to the breakout strategy, calculate the CPR levels after the market opens.
- Watch for price to approach any of the CPR levels (CP, UP, or LP).
- If the price bounces off the CPR level, it may indicate a potential reversal. Enter a trade in the direction opposite to the bounce (e.g., buy if it bounces off LP, sell if it bounces off UP).
- Again, use stop-loss orders to protect your position.
3 CPR and Moving Averages Strategy:
- Combine CPR with moving averages to add another layer of confirmation to your trades.
- Wait for the price to cross above the CP level and the 50-day moving average for a bullish signal or below the CP level and the 50-day moving average for a bearish signal.
- Take a long position if both conditions are met (price above CP and 50-day moving average) and a short position if both conditions are met (price below CP and 50-day moving average).
4 CPR and Candlestick Patterns Strategy
- Use CPR in conjunction with candlestick patterns to identify potential reversals or continuation signals.
- Look for candlestick patterns such as doji, hammers, shooting stars, or engulfing patterns near CPR levels.
- Combine the signals from candlestick patterns with CPR breakout or bounce strategies to make your trading decisions.
Remember that no trading strategy is foolproof, and it's essential to manage risk properly by using stop-loss orders, position sizing, and not risking more than you can afford to lose. Additionally, backtest any strategy thoroughly and consider paper trading it before using real money in the market. Always stay informed about the latest market developments and adapt your strategy as needed.
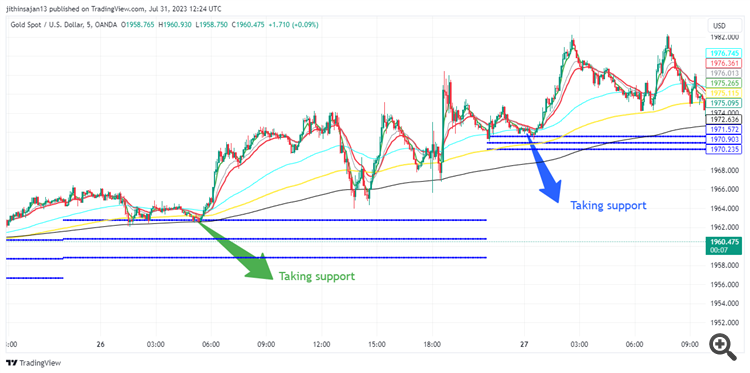
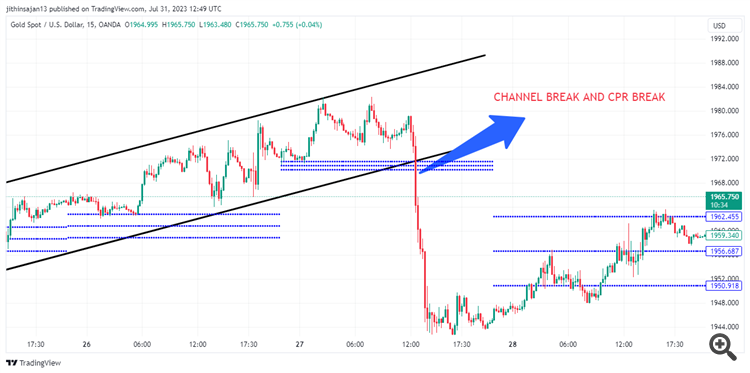
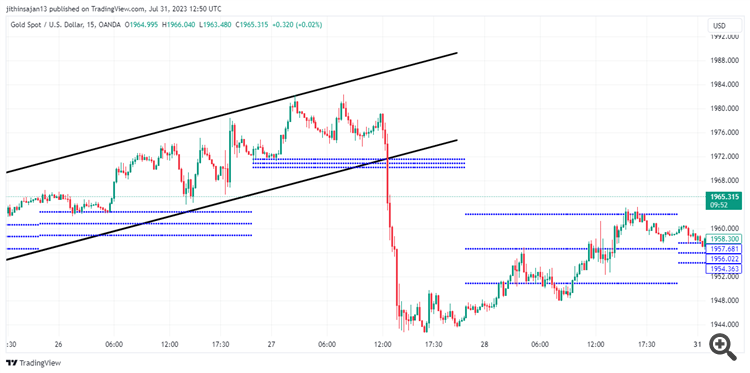
EXAMPLES CPR STRATEGIES IN DIFFERENT SYMBOLS
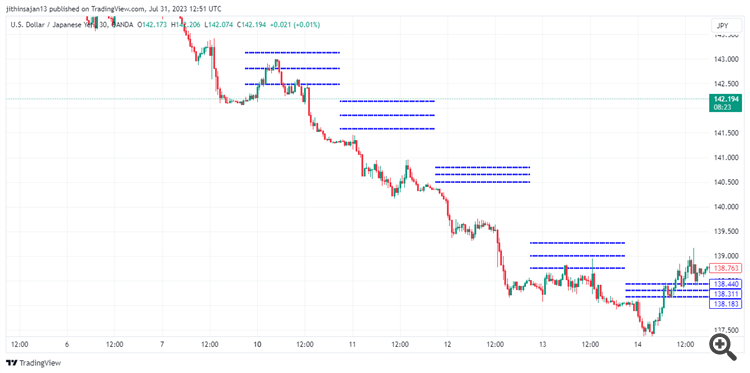
(2) USDJPY
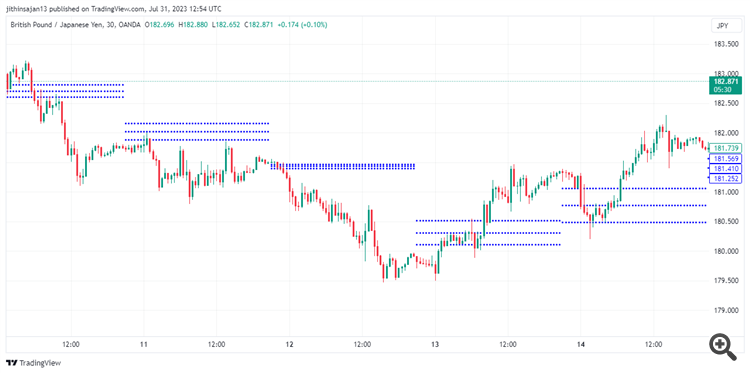
(3) GBPJPY
Conclusion
In conclusion, trading strategies involving CPR (Central Pivot Range) can be useful tools for identifying potential support and resistance levels in the market. By incorporating CPR into your trading approach, you can gain insights into price movements and make more informed trading decisions. However, it's crucial to remember that no trading strategy guarantees profits, and the markets can be unpredictable.
Here are some key takeaways:
CPR as a Support/Resistance Indicator: CPR helps identify critical price levels for the trading day, which can act as support or resistance.
CPR Breakout Strategy: You can enter long or short positions when the price breaks above the upper pivot (bullish) or below the lower pivot (bearish).
CPR Bounce Strategy: Look for potential reversals when the price bounces off CPR levels, and consider entering trades in the opposite direction of the bounce.
Combining Indicators: You can enhance your trading strategies by combining CPR with other indicators like moving averages or candlestick patterns for additional confirmation.
Risk Management: Always use stop-loss orders to protect your capital and manage risk effectively.
No Guarantee of Success: Even with well-designed strategies, trading involves risks, and there are no guarantees of profits. Practice risk management and only trade with money you can afford to lose.
Stay Informed: Stay up-to-date with market news and developments, as this information can impact your trading decisions.
Remember that trading requires discipline, patience, and continuous learning. Test your strategies thoroughly, be open to adapt as market conditions change, and avoid emotional decision-making. Over time, with experience and dedication, you can refine your trading skills and improve your chances of success.


0 Comments